
This article, originally published in @theu, February 26, 2020, was written by Paul Gabrielsen, Science Writer, University of Utah Communications
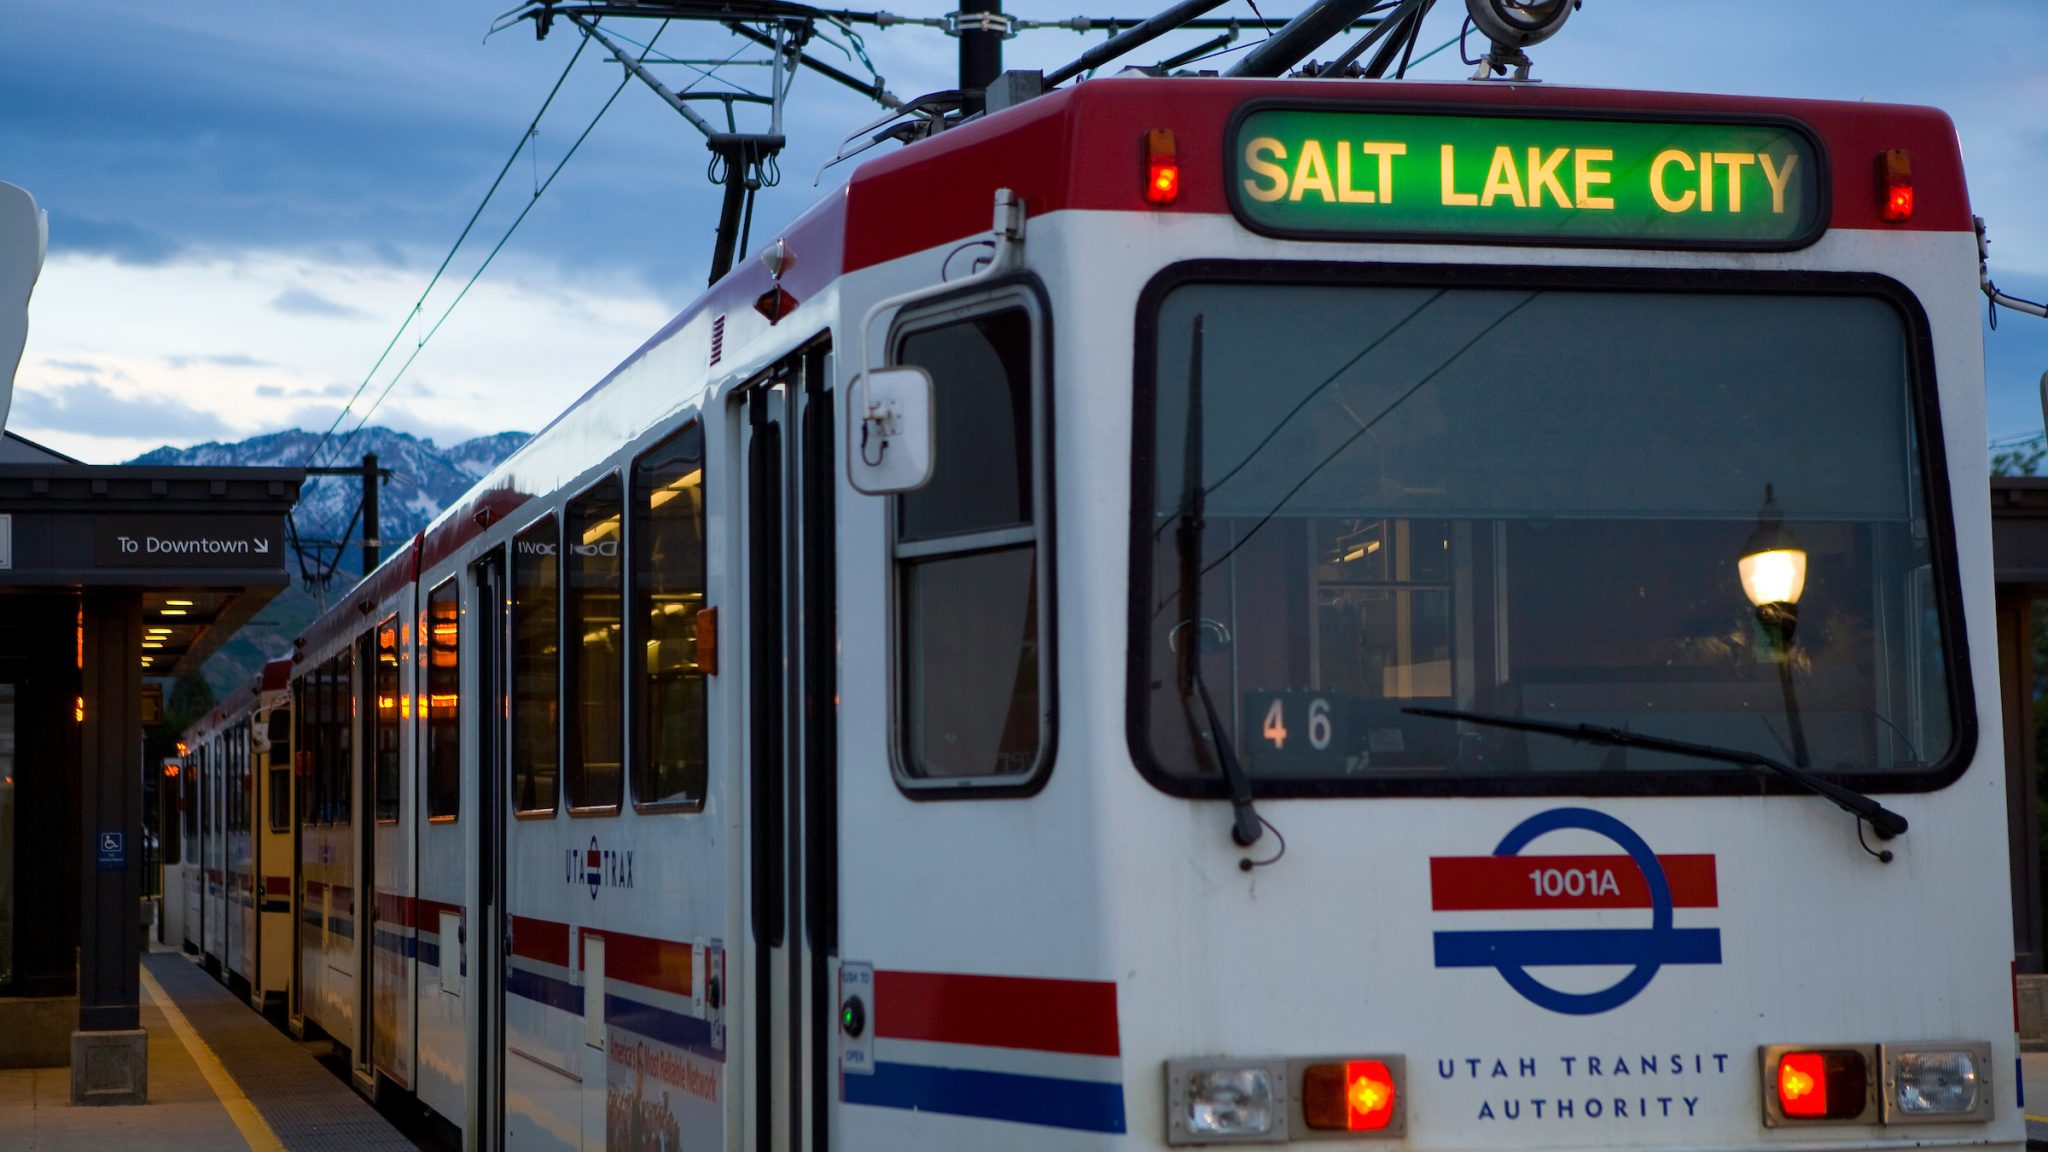
For more than five years, University of Utah air quality sensors have hitched rides on TRAX light rail trains, scanning air pollution along the train’s Red and Green Lines. Now the study, once a passion project of U researchers, has become a state-funded long-term observatory, with an additional sensor on the Blue Line into Sandy and Draper and additional insights into the events that impact the Salt Lake Valley’s air, including summer fireworks and winter inversions.
In a new study published in Urban Science, researchers including Daniel Mendoza and Logan Mitchell report the latest from the TRAX Observation Project, including data validation studies that bolster the data’s value for other researchers and three case studies from recent events showcasing the abilities of the mobile air quality sensors.
What’s new: Blue Line and data validation
UTA’s TRAX system consists of three light rail lines: red, green and blue. Up until November 2019, U sensors measuring ozone and particulate matter were installed only on the Red and Green Line trains, because both lines used the same train cars. These two lines travel through downtown Salt Lake City, the central I-15 corridor and the valley’s west side. With an additional sensor on the Blue Line, however, air quality measurements now extend into the Salt Lake Valley’s southeastern quadrant.
“That’s a really important area of the valley,” Mitchell says. “There’s a lot of people down there.” The Blue Line also goes up and down in elevation, just as the Red Line does as it ascends from downtown Salt Lake City to the U campus. “Since elevation is such a key part of the air quality and understanding the depth of the inversion on different days, under different conditions,” he says, “it’s going to be a really important piece of the dataset for us.”
Extending into the south valley also allows researchers to learn more about how air masses move back and forth between Salt Lake and Utah counties, through the narrow Point of the Mountain passage.
“That’s actually really critical because we sometimes have very different meteorological phenomenon going on between the two valleys,” Mendoza says. “We can now examine in our basin an exchange of air masses.”
The other major development in the TRAX Observation Project is the validation of the data coming from the mobile sensors. This is an important step in a pioneering project such as this, and serves along with quality assurance and quality control protocols as a certificate on the archived data now being made available to other researchers. It also assuages any concerns that the air turbulence caused by the moving train might skew the readings.
The experiment involved a stationary particulate matter sensor placed about 10 feet (3 m) from the rail line that would take readings whenever the TRAX trains were within 500 feet (150 m) of the sensors. Comparing the mobile and stationary readings, Mendoza says, showed 96% accuracy. “That really gives us a great deal of confidence that our TRAX sensors are actually performing really well compared to regulatory sensors and can be used for health studies, policy and so on,” Mendoza says.
Watching the fireworks
With five years of continued observations, the TRAX Observation Project has captured many air quality events. Mendoza, Mitchell and their colleagues document three particular events in their paper: an elevated ozone event from August 2019, a cold air pool inversion event in November 2019 and the fireworks on July 4, 2019.
The fireworks event was unique—it wasn’t a phenomenon caused by an atmospheric event or by the geography of the Salt Lake Valley. It was an incidence of multiple point sources of particulate matter air pollution, allowing observation of how those plumes of particulate matter moved through the valley.
Following generally good air quality, hotspots of elevated pollution started appearing in the TRAX data between 10-11 p.m. on Independence Day. By midnight, the majority of the valley was experiencing moderate to unhealthy air quality.
Mendoza says that the train data shows not only the dispersion of the smoke—something you don’t see in wintertime inversions, which have low atmospheric energy—but also the evening winds coming down Emigration Canyon on the valley’s east side, which washes out some of the air pollution.
“These are examples of the kinds of things that we’re seeing that you couldn’t see with stationary monitors,” Mitchell adds. “It’s helping us understand where the gradients are in the valley, how they evolve through pollution events such as during the Fourth of July or an inversion or an ozone event. You can see the air masses moving around. You can see where the pollution is and how it moves from different parts of the valley.”
Next steps
Next, Mitchell says, the team hopes to add sensors that measure oxides of nitrogen and carbon monoxide, both important components of atmospheric chemistry. They’d also like to expand the study to light rail trains in cities such as Portland or Denver.
“It would be really interesting for us to be able to compare the spatial patterns we’re seeing here with another city that has different topography around it and a different mix of emission sources,” Mitchell says, “so that we can understand how cities, in general, are being affected by these things and how that’s similar or different from what’s going on in Salt Lake City.”
Find the full study here.
Media Contacts
Logan Mitchell | research assistant professor, Department of Atmospheric Sciences
logan.mitchell@utah.edu
Daniel Mendoza | research assistant professor, Department of Atmospheric Sciences; pulmonary fellow, Division of Pulmonary Medicine, School of Medicine
Office: 801-585-6861 | Mobile: 801-505-8253 | daniel.mendoza@utah.edu
Paul Gabrielsen | research/science communications specialist, University of Utah Communications
Office: 801-585-6861 | Mobile: 801-505-8253 | paul.gabrielsen@utah.edu